rYPC is defined as the ratio between a player's yards per carry and the rest of the team's yards per carry, excluding QB runs. Doing this gives us a number that tells us how efficient that player was at rushing in comparison to the other runners on the team. This helps controls for offensive line and scheme, as the other runners in the offense are also benefiting or being held back by those factors.
As an example, let's look at Alvin Kamara from last year's draft class. His yards per carry number was 5.79. An above average number (average YPC in my data set is 5.41), but nothing that jumps off the page. However, the runners around him accumulated 958 yards on 215 carries, good for only a 4.46 yards per carry. This gives Kamara a 1.30 rYPC, a fairly high end number for a running back prospect. By contrast, Donnel Pumphery averaged a higher yards per carry (6.11) than Kamara, yet came in a much lower rYPC (0.80) based on the performance of players around him.
Now, the idea sounds good in a vacuum, but is it actually any good for projecting how these running backs will play in the NFL? Well, let's take a look at a few plots, using data from 2007 to 2013:
This graph plots approximate value per season against the natural log of draft position. As we can see, the relationship is pretty clear, other than the two at the very end (Trent Richardson and Darren McFadden).
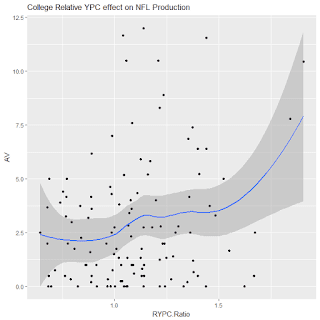
As we can see, the relationship is much smaller, but there is some signal here. Only two running backs with a rYPC below 1.0 have ever averaged more than 5 AV per season, while more than a dozen above 1.0 have. At the very high end, the top two scorers in rYPC were great players in the NFL (Matt Forte and Jamaal Charles).
When we combine both draft position and rYPC, the relationship between them increases than using either of them alone. As we can see, Trent Richardson and Darren McFadden are not nearly as big of outliers, because both of them had well below average rYPC numbers (0.89 and 0.77 respectively).
Things get quite a bit interesting when we look at just the top 3 rounds of the draft:
When removing the last 4 rounds of the draft (who are by definition, extreme long shots), the relationship between draft position drastically lowers. The r^2 goes from 0.322 to 0.079.
While the relationship between draft position and NFL production got weaker, the relationship between rYPC and NFL production gets stronger when only the top 3 rounds are considered. In fact, the r^ 2 value of rYPC is actually BIGGER than draft position in the first 3 rounds (0.079 vs 0.084).
As in the full sample, combining both draft position and rYPC results in a better correlation than using either factor alone.
Looking at the data, at the very least rYPC is an interesting tool to use to evaluate prospects, and a vastly superior tool compared to regular YPC (YPC had a r^ of 0.02 and 0.005 in the full sample and top 100 picks sample respectively, no correlation).
When we look at the draft classes from 2014 to 2017, the top four rYPC numbers are Jordan Howard, Aaron Jones, Dri Archer, and David Johnson. While Archer never broke out (and one would argue was never a true RB), Howard, Jones, and Johnson all look to be at the very least much better than their draft position.
Here's how the running backs selected in the top 100 picks of this year's draft ranked in rYPC:
0.96
|
|
Surprise first round picks Rashaad Penny and Sony Michel form the first tier of runners, while Ronald Jones follows close behind. Perhaps surprisingly, consensus top RB Saquon Barkley looks fairly pedestrian by this measure. However, it's important to note that rYPC only looks at a running back as a runner, and Saquon offers significant value in the passing game. Freeman and Guice are just about at a 1.0 rYPC, which shouldn't be a giant red flag but also shouldn't inspire great confidence. Chubb is below average, but he also had to share a backfield with Michel, which could dilute how good Chubb really is. However, we had a similar situation with Mixon and Perine last year in Oklahoma and the vastly inferior player in rYPC (Perine) seems to be on his way to the bench after an ineffective year on the ground.
The guy with the biggest red flag is Kerryon Johnson. Johnson was less efficient than other Auburn runners like Kamryn Pettway, Kam Martin, and hybrid player Eli Stove. This trend also held true in 2017, where Johnson was the least effective back in the rotation. If I had to pick one player from this year's top 100 backs to bust, I would choose Kerryon without much of a second thought.


No comments:
Post a Comment